Hunter vs Farmer Sales Model: What is your strategy? Sumeet Soni February 6, 2020
Key data ask for this analysis is to determine whether a sale is to an existing customer or to a new customer. This helps categorize each sale and gauges whether the rep is behaving as a hunter or farmer. Once the sale has been categorized, aggregate behaviour can be visualized using the following charts.

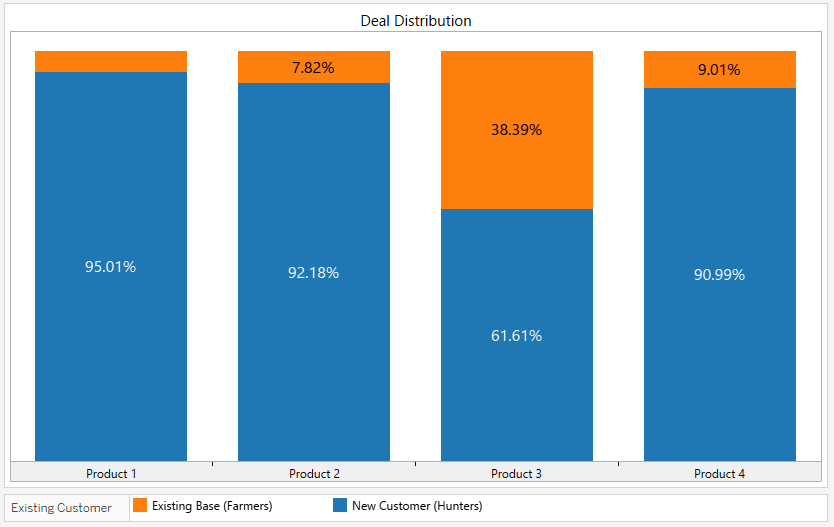
The above chart illustrates on average whether reps are selling to existing customers or to new customers by displaying a percentage of deals from existing customers vs new customers for each product. Here, the reps are focusing more on hunting behaviour for all the products except product 3.

Above chart shows revenue share distribution while selling to existing customers vs new customers. For product 3 the combination of these two charts reveals an interesting insight. “Revenue Share” chart tells us only 18% of Revenue for product 3 is from existing customers (farming behaviour), whereas it constitutes 38.39% of total Product 3 deals. This proposes the possibility of high discounts being offered to existing customers for product 3.

The above chart shows revenue per deal for each product, which gives us a rough estimation about the effective pricing for each product when it has been sold to existing and new customers. Here, revenue per deal for product 3 is less for existing customers as compared to new customers since the proportion of deals far outstrips the proportion of revenue.
Such hunter-farmer analyses can help identify key insights into selling behavior of reps within each product or whether some structural issues exist that’s reducing sales performance in certain segments. Drilling down to division or region to see how individual markets and segments behave can reveal characteristics of the sales process in those segments. Such analysis can help you course correct for structural issues, level the playing field for reps across segments and also analyze how your top performers are bringing in the sales that are helping them perform.
Incentius can help analyze your selling teams along these dimensions are delve into much more detail to answer broad questions like:
– Are my top performers more farmers and less hunters?
– What is the bulk of my salesforce doing? Are they farming the base and exploiting latent potential in my customer base or are they grabbing new accounts and bringing in more accounts into the customer base? Is that in line with my sales strategy?
– Do I need to tweak my incentives to encourage sales reps to manoeuver in one direction or the other?
Drop us a note at info@incentius.com. Read more about our services at www.incentius.com

